The R&S ZPH-K15 interference analysis and R&S ZPH-K16 signal strength mapping options are great tools for analyzing and locating ambiguous signals or interferers.
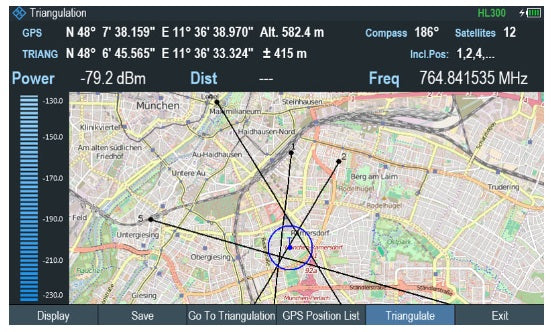
In the interference analysis mode, you can perform both spectrogram and triangulation measurement functions.
Long-term spectrogram recording allows up to 999 hours of on-air activity to be captured; the recording duration depends on the recording interval setting. The recorded data can be analyzed on the R&S ZPH or with the R&S Instrument View software.
The spectrogram result display shows the spectral density of a signal in the frequency domain and over time simultaneously.
Like other result displays, the horizontal axis represents the frequency span. The vertical axis represents time. Time in the spectrogram runs chronologically from top to bottom. Therefore, the top of the diagram is the present. A third dimension shows the amplitude for each frequency by mapping different colors to every power level. The result is therefore a two-dimensional diagram.
The color the R&S Cable Rider ZPH assigns to a power level that was measured depends on:
The spectrogram consists of horizontal lines, each of one pixel height, which is called frames. In the default state, a frame is added to the spectrogram after each sweep.
By default, the spectrogram result display consists of two windows. The upper window shows the measured spectrum as a trace line. The lower window shows the measurement results in a spectrogram. The chronological information in the spectrogram is restricted by the internal memory of the R&S Cable Rider ZPH. The R&S Cable Rider ZPH stores 1024 frames or spectrums that have been measured in its memory. As the height of the display is smaller, some of the data becomes invisible after a time.
*The image is for reference only. See product specifications for details.
Model No
ZPH-K15
Condition
New
Manufacturer
Rohde & Schwarz

30+ Years in Business
Secure Payments
Sell Test Equipments
Knowledgeable Staff
On-site Lab
30+ Years in Business
Secure Payments
Sell Test Equipments
Knowledgeable Staff
On-site Lab
Request A Quote
 Chat Live
 Contact Us
 sales@valuetronics.com