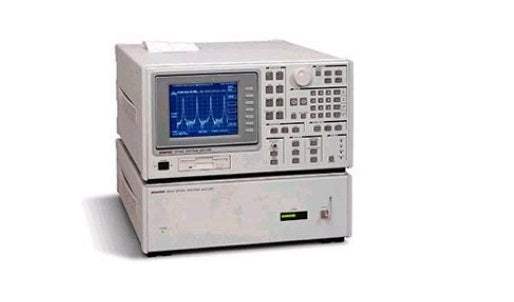

Specifications
Wavelength
Level
Measurement Range (Input Sensitivity):
The minimum level is measured over a 50 nm span and averaging 16 times.
Processing Functions
Input/Output
General Specifications
The Advantest Q8347 spectrum analyzer enhanced the performance of spectrum analyzer employing a Fourier spectrum system with a Michelson interferometer. The Q8347 achieves wavelength resolution of 0.01 nm and wavelength accuracy of ±0.01 nm (resolution of 1 GHz and accuracy of ±1 GHz in optical frequency mode) at the 1550 nm spectrum band. In addition, the Q8347 is capable of accurately measuring each wavelength of optical wavelength division multiplexing (WDM) transmission signal by separating the spectrums. It is especially suitable for evaluating characteristics of optical narrow-band-pass filters used for WDM like AWG and Fiber gratings. Also, the Q8347 is powerful for analyzing chirps from LDs and Soliton transmission.
A resolution of 0.001 nm at the 500 nm band
At shorter wavelength, higher resolution can be obtained. The Q8347 has a resolution of 0.001 nm at the 500 nm band, most suitable for analysis of blue LDs.
Trend monitoring function
Incoming power and wavelength can be displayed in digital read-out, as well as a time domain trend chart.
Printer and floppy-disk drive equipped as standard
The system comes with high-speed thermal printer capable of copying the display in 8 seconds. Also, the system has a floppy-disk drive using MS-DOS, allowing easy data storage and analysis. Furthermore, data are stored in text format, facilitating analysis and processing on a personal computer. Also, stored data can be zoomed subsequently.
Optical frequency can be displayed
In addition to general wavelength display mode, a measured spectrum can be displayed as optical frequencies. As light can be directly read in units of THz, it is useful for measuring optical WDM and chirps from LDs, and for analyzing Soliton transmission system.
Coherence analysis of ±165 mm
As the Q8347 uses a Michelson interferometer, the system is capable of performing coherence analysis. This function allows easy evaluation of noise suppression performance of LDs for optical discs. Furthermore, the stroke of the interferometer can be greatly increased to allow analysis to be made in a range of ±165 mm. Thus, more detailed analysis can be mode, over and above the conventional secondary maximum peak value (α value).
Curve fitting function
The Q8347 provides curve fitting with sech and Gaussian functions. Thus, it is useful for spectrum analysis of Soliton transmission system.
List display
Peak values of spectrum or coherence data can be displayed as numerical data containing up to 200 points. The separation and the level of each channel of optical WDM transmission system can be seen at a glance.
High-speed measurement
The process from trigger to SRQ output takes only 1.0 second in normal resolution mode by using the GPIB, or 2.5 seconds in high-resolution mode. (At long-wavelength band).
Measurement principles
The Q8347 employs the Fourier spectrum system using a Michelson interferometer. The light from the device under measurement is split into two parts and interference introduced between the two resulting paths. The interferogram, taking the optical path difference as the horizontal axis and the interference light intensity as the vertical axis, makes an autocorrelation of the light to be measured.
Thus, coherence can be displayed from the interferogram. Also, the optical spectrum can be obtained by performing Fast Fourier Transform (FFT) over the interferogram. As an He-Ne laser is used as the wavelength reference source, the axes of the wavelength and optical path difference are extremely accurate.
Applications
High resolution measurement of spectrums extremely close to each other
The Q8347 accurately measures spectrums extremely close to each other, for example it measures spectrums for WDM transmission systems which employs spectrums separated at 0.1 nm (Approximately 10 GHz at wavelength of 1550 nm).
Measuring the transmission characteristics of optical narrow-bandpass filters
As a system with high-power, wide-band light source such as spontaneous emission light of EDFA or edge-emitting LED, the Q8347 accurately measures the transmission characteristics of optical narrow-band-pass filters employed for EDFA systems at the accuracy ±0.01 nm. In measuring a filter with spectral-width of 1 nm, dynamic range is 35 dB (Averaging 16 times). Linearity at the level 30 dB down from the central wavelength is ±0.5 dB or less.
Spectrum measurement of ultra-short light pulse
With the Q8347, spectrum stretch of ultra-short light pulse, Soliton transmission for example, can be directly viewed.
The figure to the right is a copy of the data showing the spectrum width when the ultra-short light pulse at 10 GHz repetition was measured and curve fitting performance with sech function.
Coherency analysis at long span
The Q8347 measures coherency of LDs and SLDs (Super Luminescent Diode) to ±165 mm maximum, therefore, the detailed analysis of the device is possible. Also, the 2nd peak value (α value) can be measured and displayed by normalizing the coherence at the maximum peak value with zero optical path difference.
Model No
Q8347
Condition
Used
Manufacturer
Advantest
Request A Quote